Business Area
Marketing analytics and campaign performance
Data Analytics Case Study
Evaluating campaign performance across channels, customer segments, companies and time using more than 200,000 marketing records
Python • Pandas • NumPy • Matplotlib • Seaborn • Tableau • Exploratory Data Analysis • Business Reporting
This project analyses marketing campaign performance across multiple business dimensions, including campaign type, marketing channel, customer segment, company performance, acquisition cost, engagement, impressions, clicks, conversion rate and return on investment.
Marketing analytics and campaign performance
More than 200,000 campaign records
Evaluate campaign performance and identify meaningful optimisation opportunities
Python, Pandas, Matplotlib, Seaborn and Tableau
Marketing teams often manage campaigns across several channels, customer segments and campaign formats. Decision-makers need a clear way to compare performance and understand whether differences in ROI, conversion rate, engagement and acquisition cost are large enough to support strategic action.
This project evaluates the dataset from multiple perspectives to determine whether specific campaign types, channels, customer segments or companies consistently outperform the others.
Which campaign characteristics are associated with stronger marketing performance, and what recommendations can be supported by the available evidence?
The dataset contains more than 200,000 marketing campaign records. Each row represents a campaign observation with performance metrics, categorical descriptors and a reporting date.
Company, campaign type, marketing channel and customer segment
ROI, conversion rate, clicks, impressions, engagement score and acquisition cost
Campaign date used for monthly performance analysis
Descriptive, exploratory and correlation analysis
The project followed a structured workflow from defining the business question to communicating insights through dashboards and executive reporting.
Defined the business problem and analytical objectives.
Loaded the dataset and reviewed its structure and fields.
Validated data quality, duplicates, dates and missing values.
Compared KPIs across campaigns, channels and segments.
Created Python charts, a heatmap and Tableau dashboards.
Developed findings, recommendations and an executive summary.
This section connects the Python workflow to its analytical purpose, output and business value. Open each step to explore the process.
The Python environment was prepared with the libraries required to load, inspect, aggregate and visualise the data.
import pandas as pd
import numpy as np
import matplotlib.pyplot as pltPrepare the tools needed for the analytical workflow.
Pandas supports data preparation and aggregation, while Matplotlib supports chart creation.
These tools provide the foundation for converting raw campaign records into decision-ready insights.

The source dataset was imported into Python to begin the inspection and analysis process.

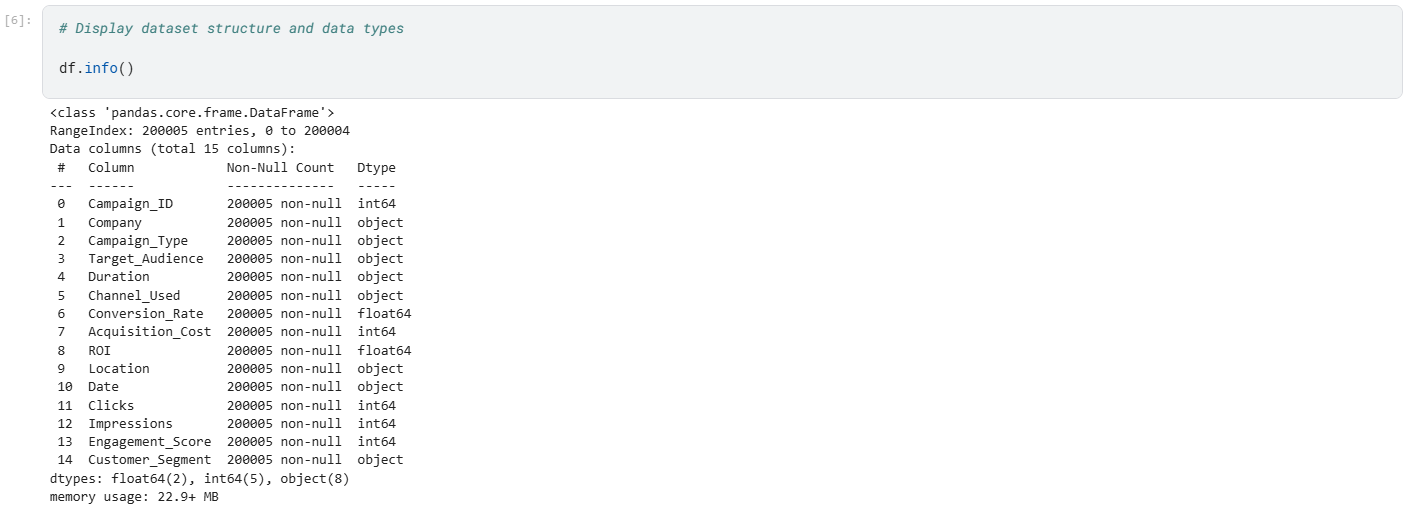
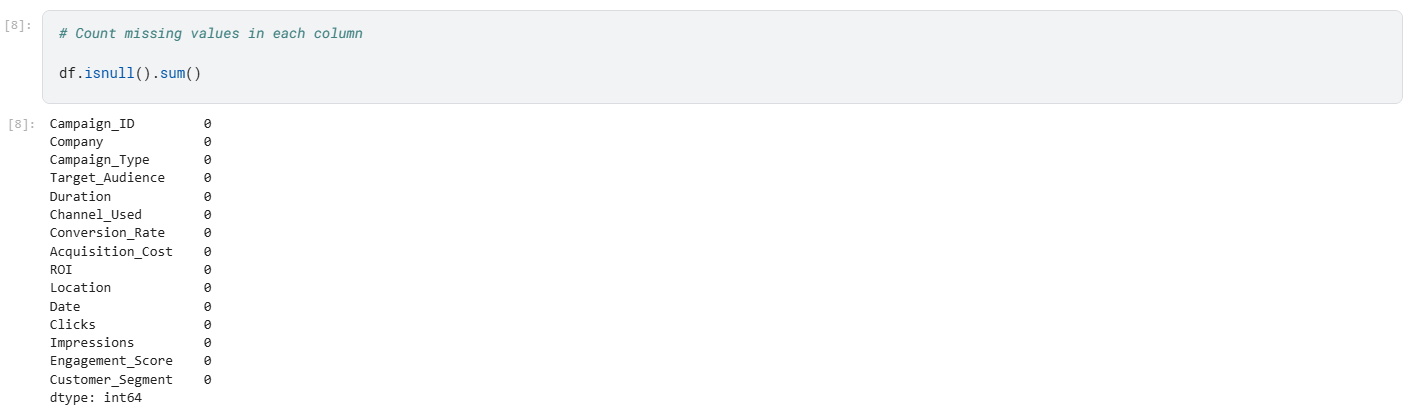
The dataset was inspected to understand its dimensions, column types, sample values and potential quality issues.
df.shape
df.head()
df.info()
df.isnull().sum()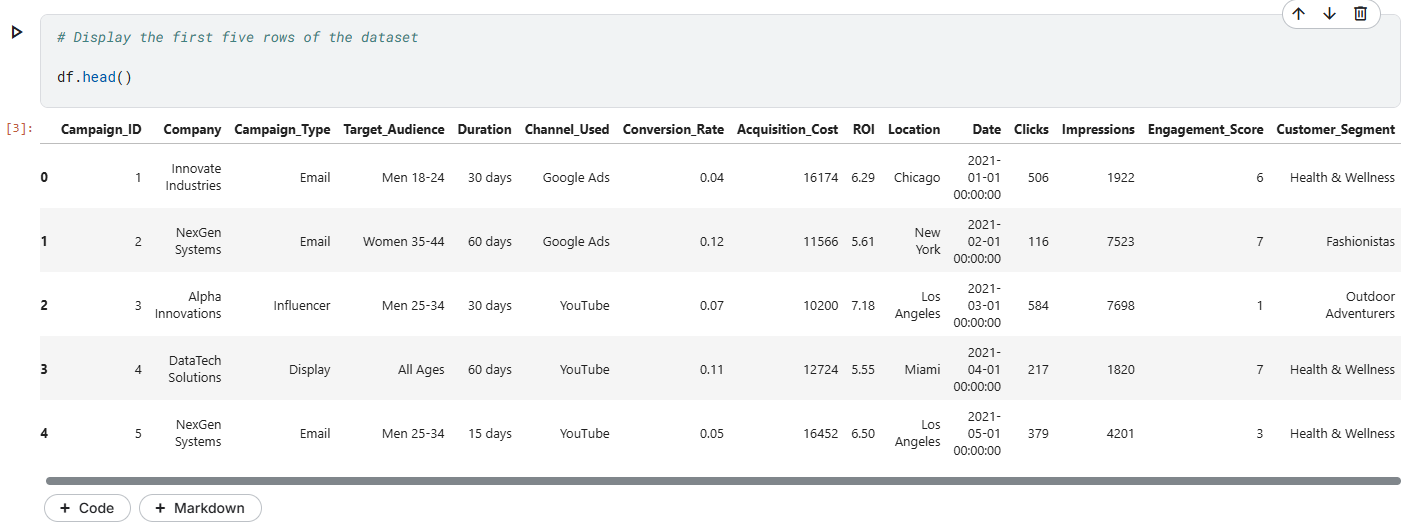
The dataset was checked for fully duplicated rows and the reporting date was converted into a format suitable for time-based analysis.
Fully duplicated rows were counted to prevent totals and averages from being overstated.
No fully duplicated records were identified, so all campaign rows were retained.
The Date field was converted to datetime format for monthly trend analysis.
The updated data type was checked to confirm that the conversion was successful.


Grouped summaries and visualisations were used to compare ROI, conversion rate, engagement, acquisition cost and monthly performance.
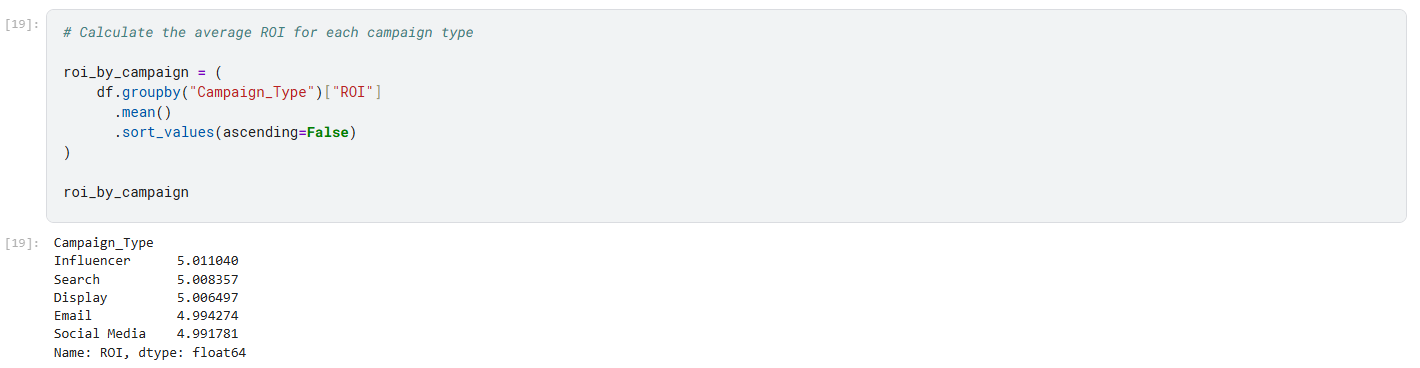
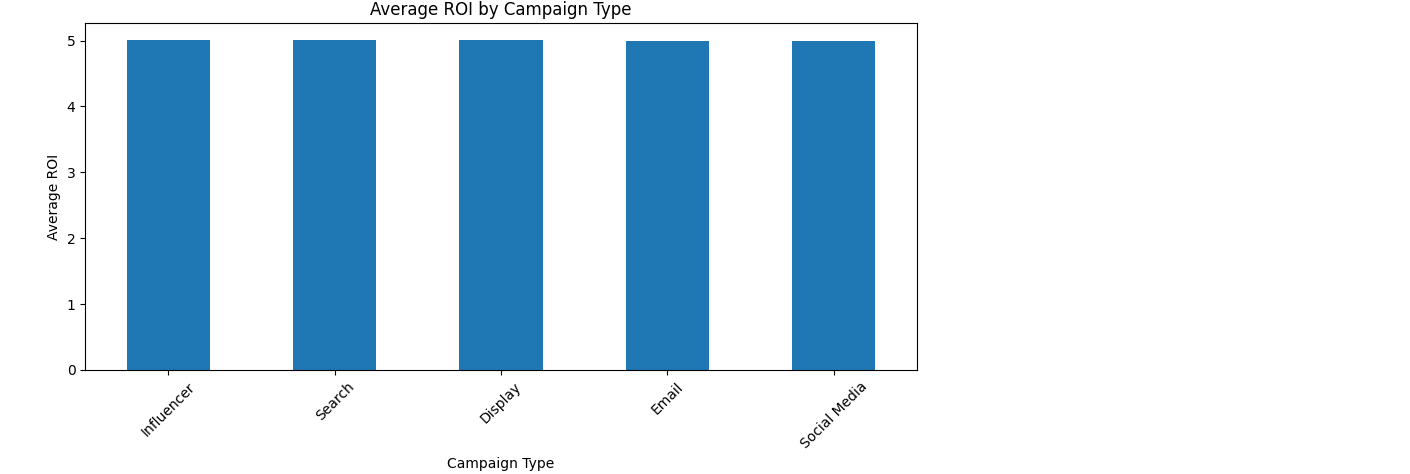
Average ROI remained close to 5 across all campaign types, with only very small differences.
No campaign type demonstrated a meaningful financial advantage within this dataset.
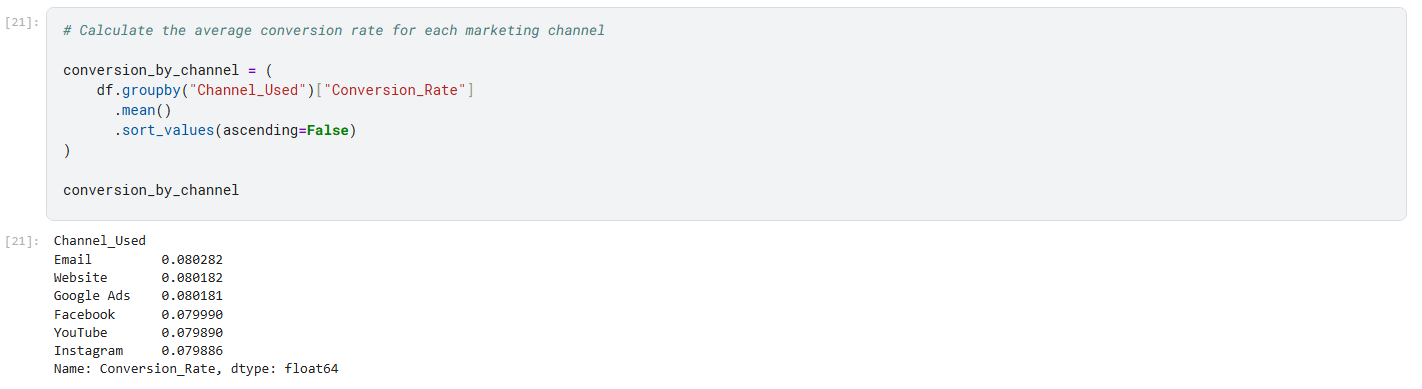
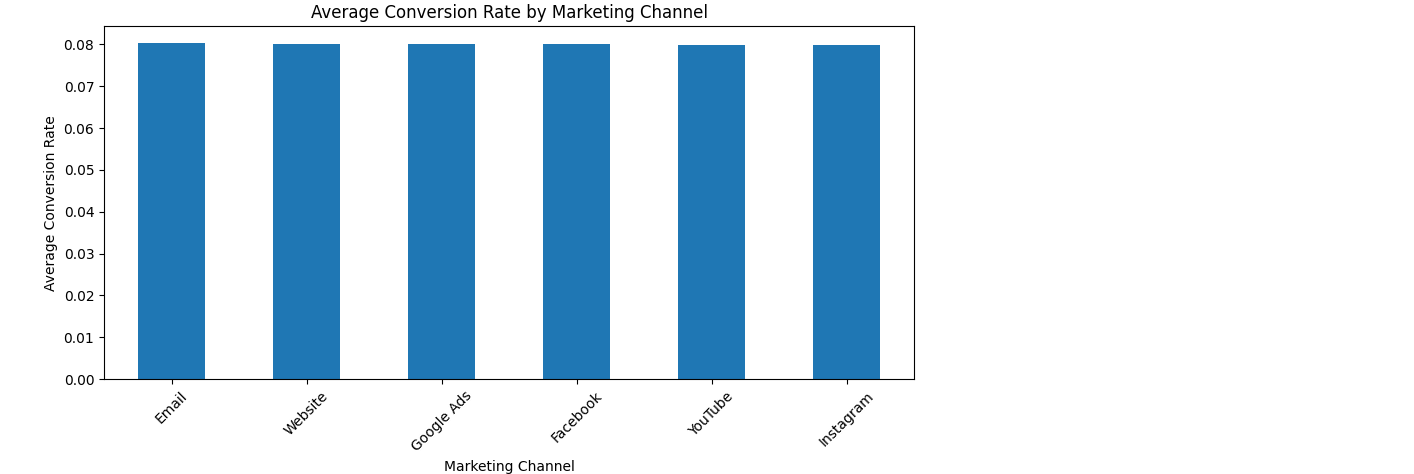
Average conversion rates were highly consistent across the available marketing channels.
Channel selection should be evaluated alongside cost, reach and engagement rather than conversion rate alone.
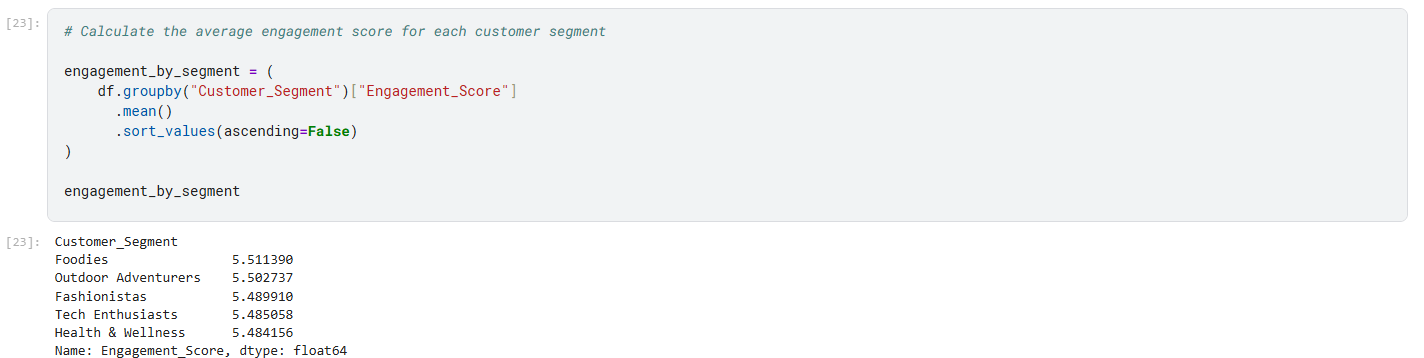
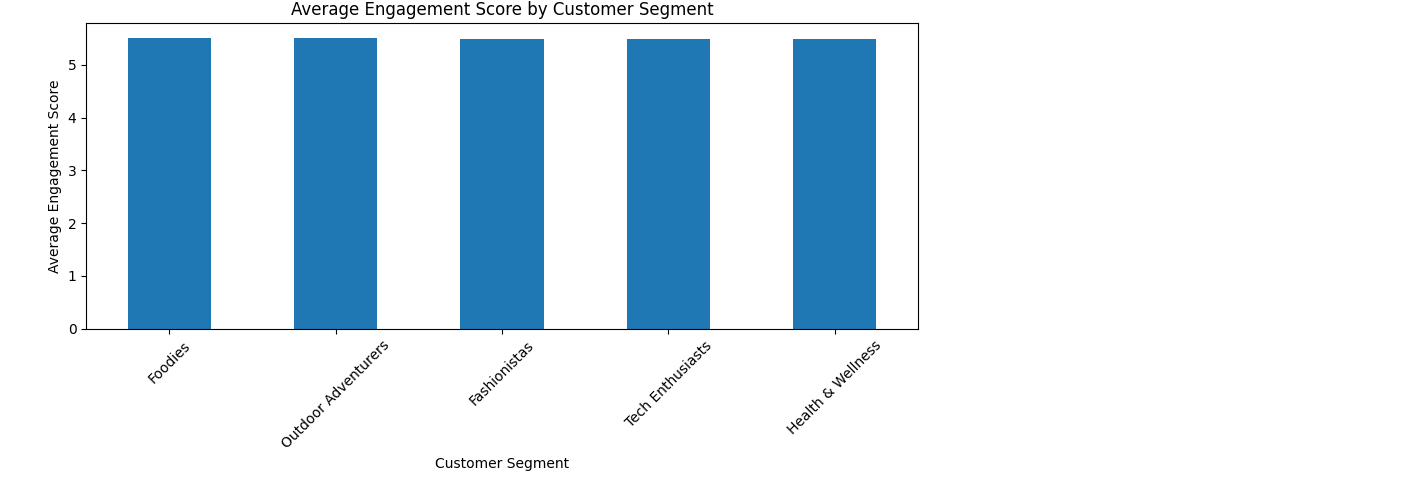
Engagement scores were distributed evenly across customer segments.
No segment displayed substantially stronger engagement, so segmentation decisions require additional behavioural information.
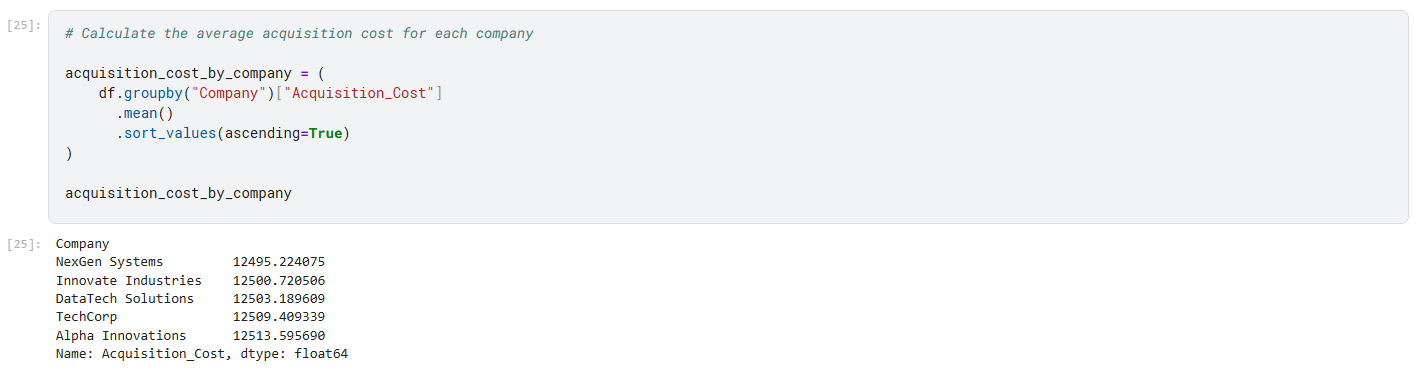
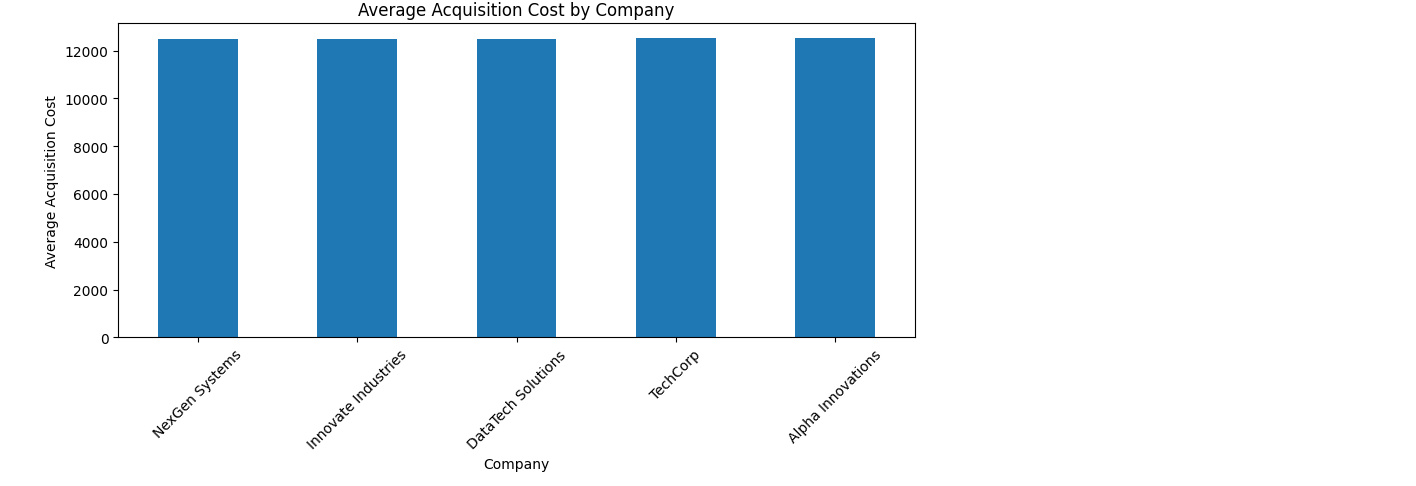
Average acquisition costs were relatively similar across all five companies.
The observed differences were too small to support major budget-allocation decisions by company.
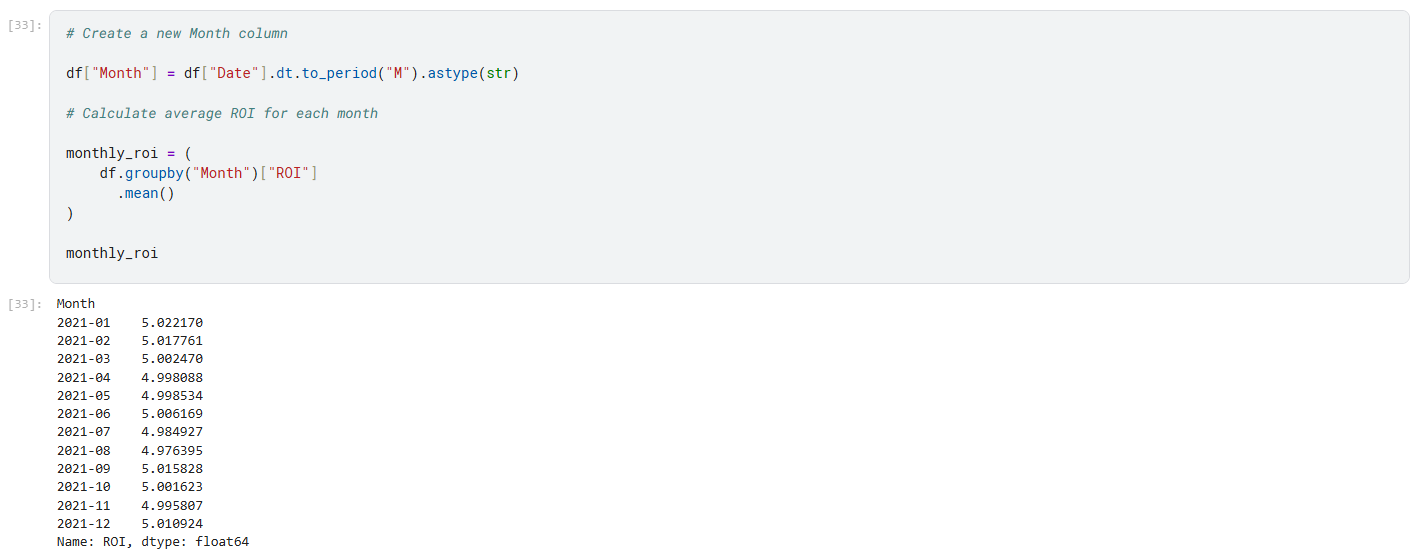
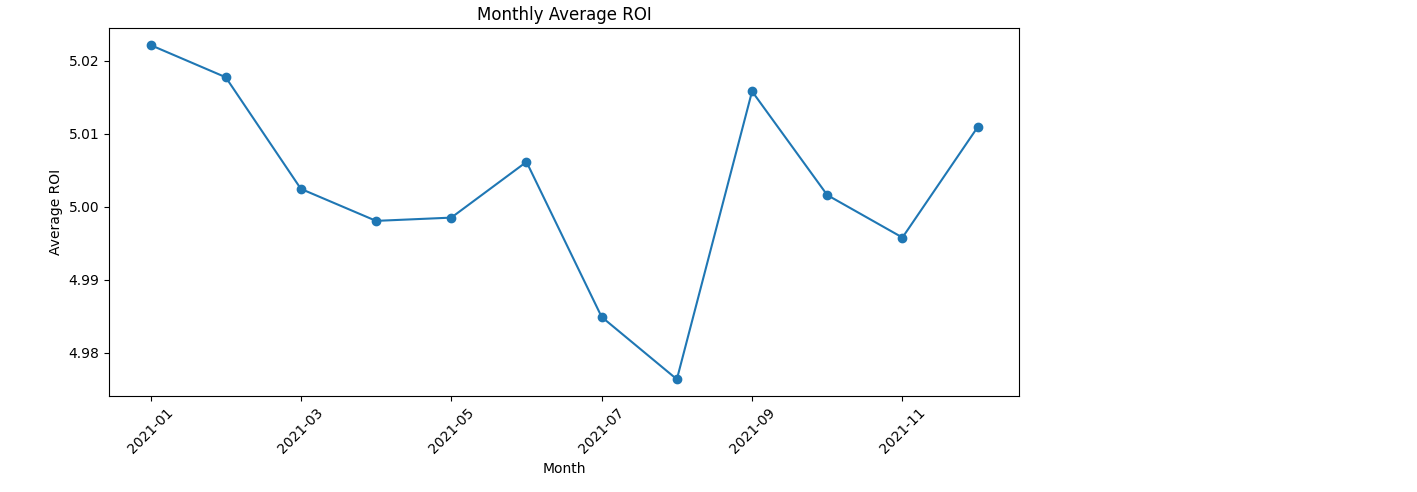
Monthly average ROI remained stable throughout the reporting period.
No significant seasonal trend or sustained monthly performance shift was identified.
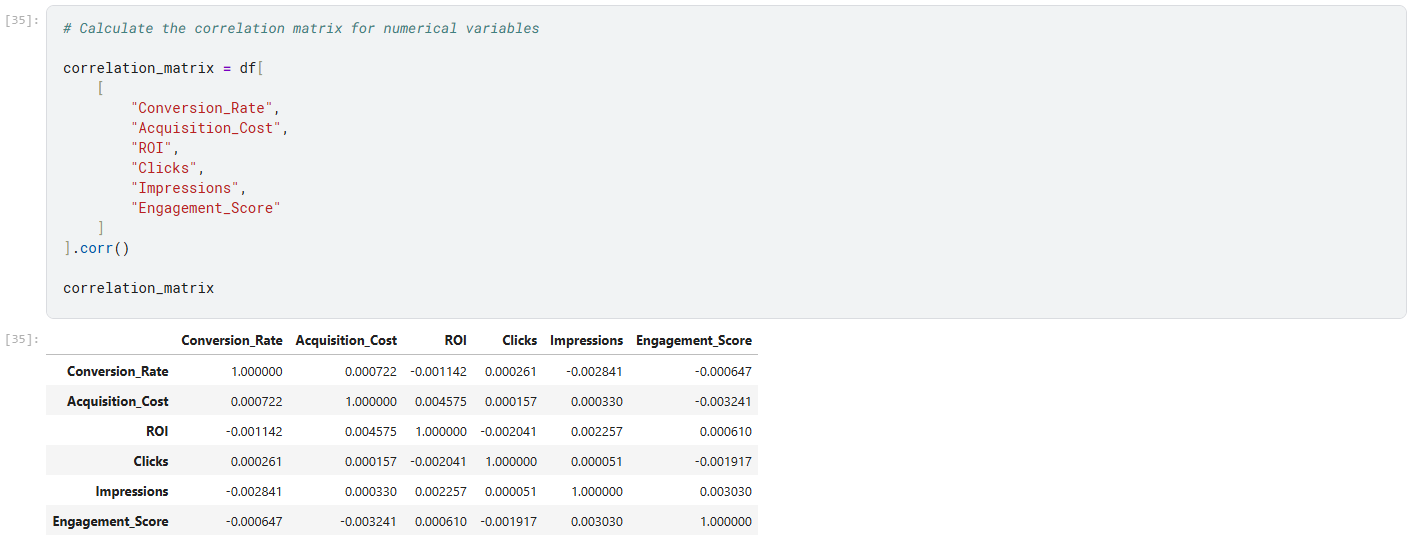
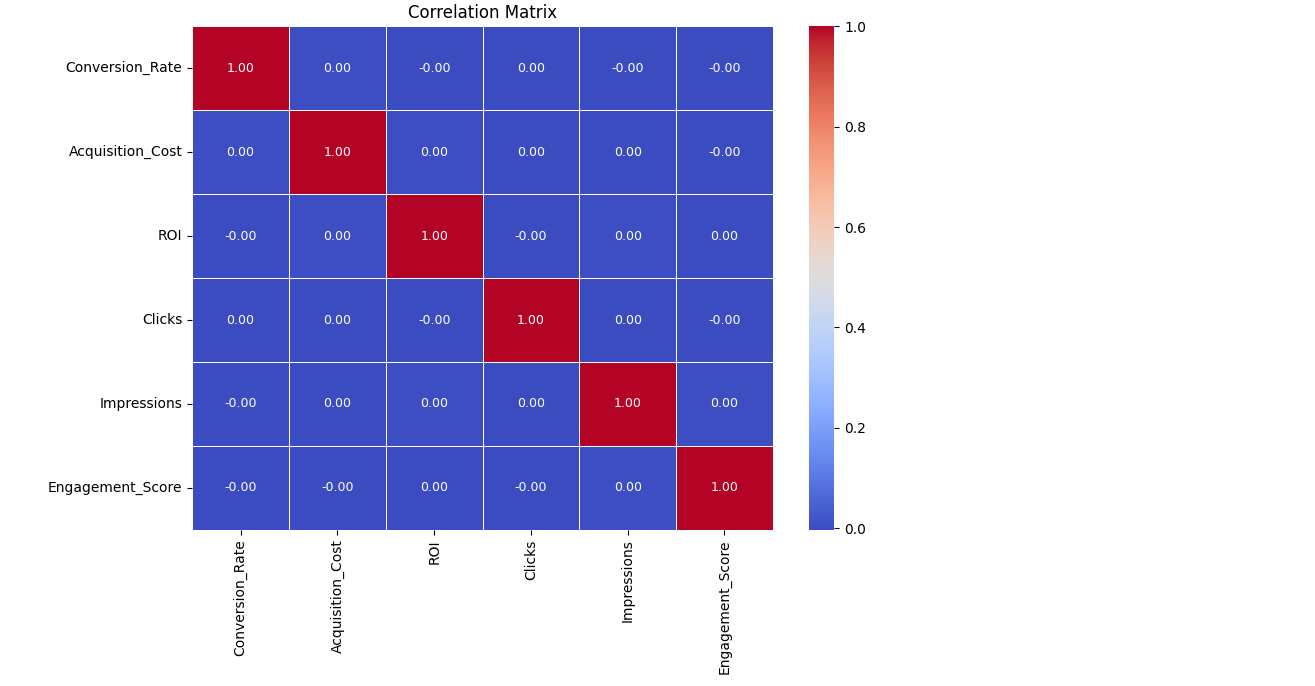
Most correlation coefficients were close to zero, indicating very weak linear relationships.
Marketing performance should be assessed through multiple KPIs rather than relying on one variable as a predictor of another.
Two dashboards were developed to present key performance indicators, comparisons and time-based trends in a concise, business-friendly format.
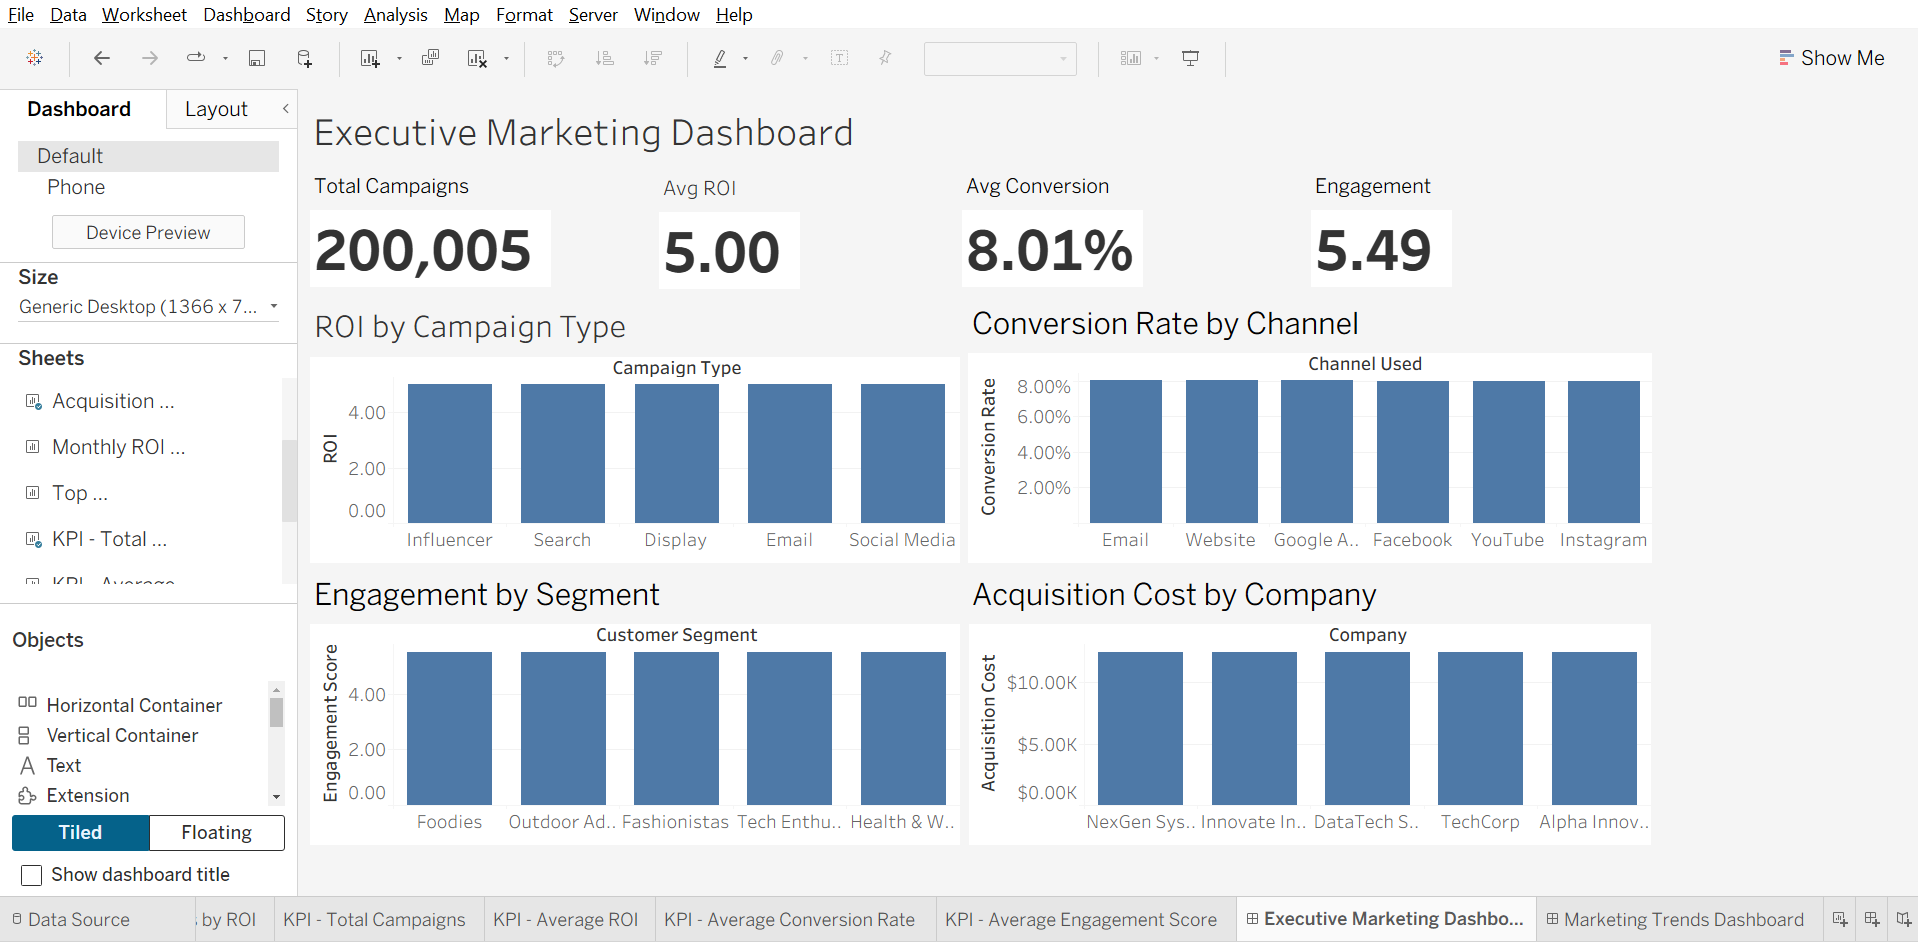
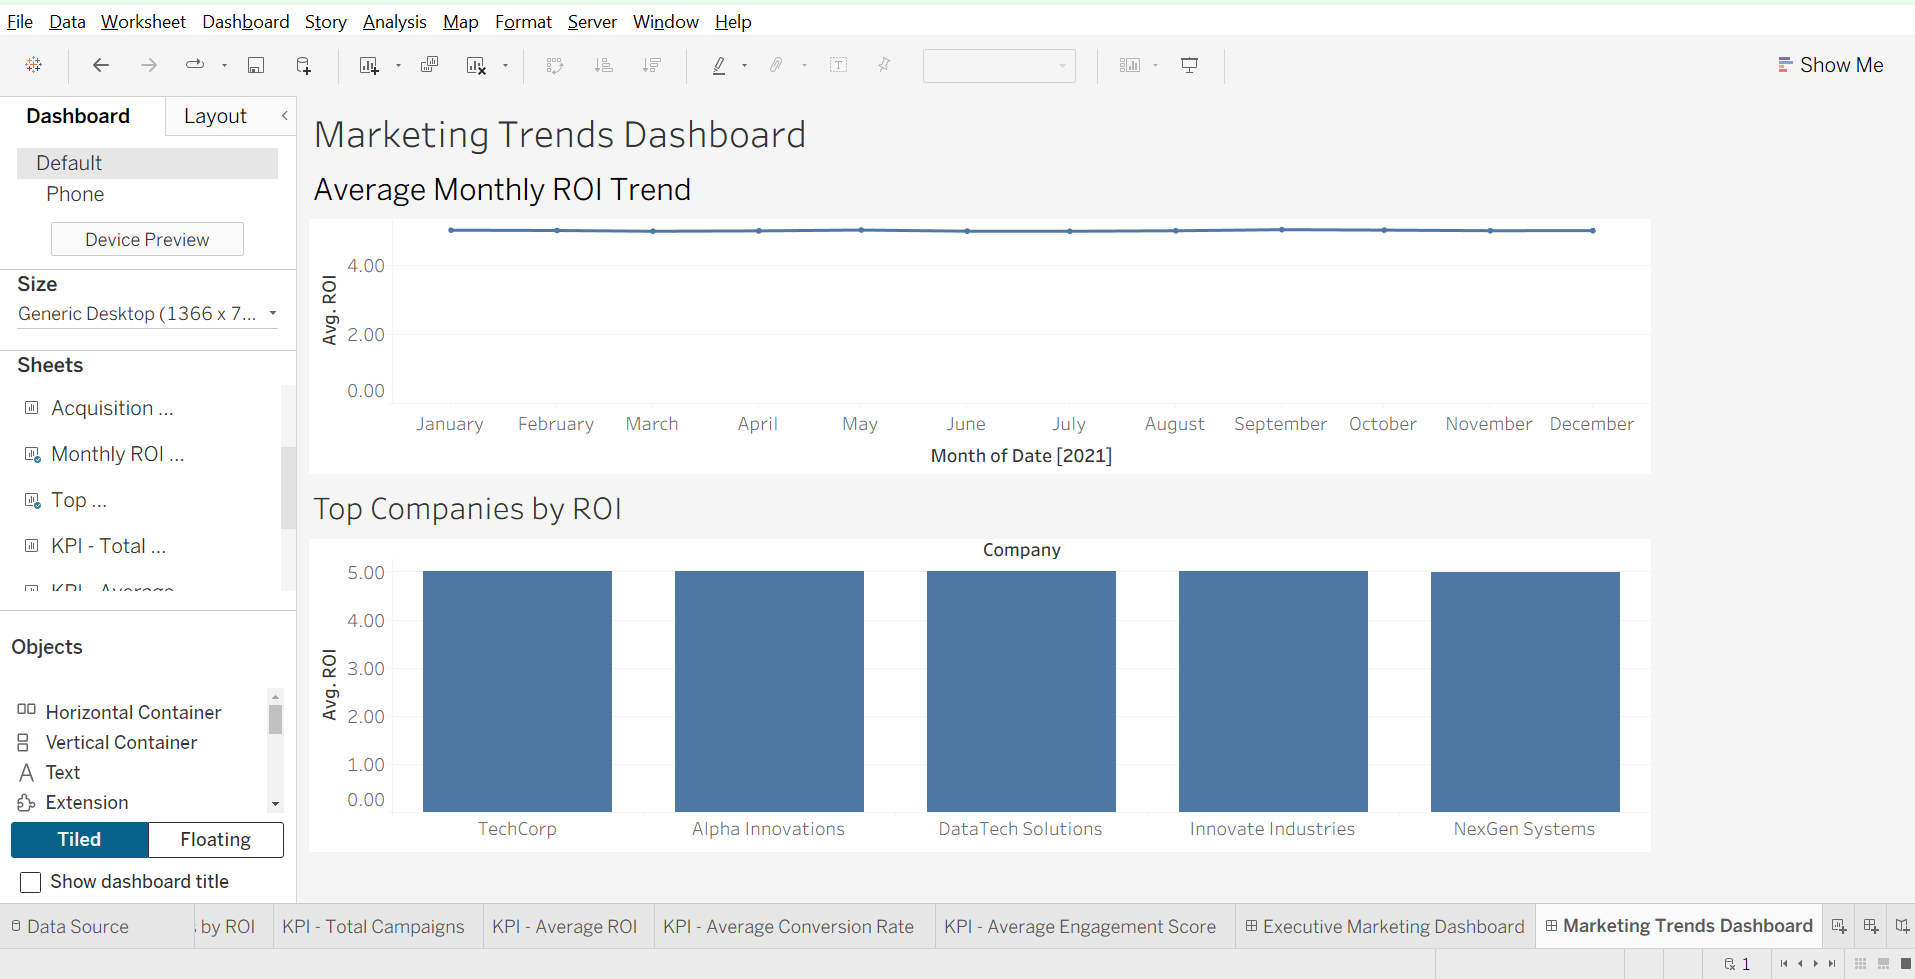
The visual analysis compares campaign performance across key marketing dimensions and tests whether meaningful differences exist.
Compares the average return on investment generated by each campaign category.
Evaluates conversion performance across different marketing channels.
Compares average customer engagement across audience segments.
Compares customer acquisition costs across the companies in the dataset.
Examines how average return on investment changed over time.
Measures the direction and strength of linear relationships among numerical marketing variables.
The dashboards translate the Python analysis into an accessible reporting format for business users and decision-makers.
Additional analyses were completed in the full notebook to validate the findings from multiple perspectives.
Click volumes were compared across channels to evaluate audience response and traffic generation.
Campaign reach was compared across campaign categories.
Distribution analysis was used to inspect spread, central tendency and possible extreme values.
Company-level ROI rankings were reviewed, although the observed differences remained small.
The analysis found that most campaign performance measures were highly balanced across categories.
Average ROI remained close to 5 across all campaign types, with no category showing a significant financial advantage.
Average conversion rates and click volumes were consistent, with no individual channel significantly outperforming others.
No customer segment demonstrated substantially higher engagement levels.
Acquisition cost and ROI were relatively similar across all five companies.
No significant seasonal trend or sustained fluctuation in average ROI was identified.
Most correlation coefficients were close to zero, suggesting that the numerical variables operated largely independently.
The findings support a balanced and multi-metric approach to marketing performance management.
Evaluate campaigns through ROI, conversion rate, engagement, acquisition cost, clicks and impressions instead of relying on a single performance measure.
Track campaign performance over time to identify future changes that may not be visible in the current balanced data.
Expand future analysis with variables such as revenue, profit, campaign duration, budget, geographic market and customer lifetime value.
Maintain Tableau dashboards to support ongoing reporting, filtering and faster management decision-making.
This project analysed more than 200,000 marketing campaign records using Python to evaluate performance across campaign type, marketing channel, customer segment, company, acquisition cost, engagement, impressions, clicks, conversion rate and return on investment.
The analysis found that the dataset was highly balanced. Most campaign types, channels, segments and companies produced similar average results, while monthly ROI remained stable and numerical variables showed very weak correlations.
Although the dataset did not reveal strong performance differences, the project successfully demonstrates a complete exploratory data analysis workflow, including data loading, validation, preparation, aggregation, visualisation, statistical analysis, business interpretation, dashboard development and executive reporting.
Explore the complete project through the Kaggle notebook and interactive Tableau dashboards. These resources include the full Python workflow, data preparation, exploratory data analysis, statistical insights, executive dashboards, and business reporting.