Business Area
Wearable technology, wellness analytics and user engagement
Google Data Analytics Capstone Project
Analysing Fitbit activity and sleep behaviour to identify user patterns and support data-driven wellness recommendations
Python • Pandas • NumPy • Matplotlib • Tableau • Data Cleaning • Feature Engineering • Correlation Analysis • Exploratory Data Analysis
This case study analyses Fitbit activity and sleep records collected between March and May 2016. It explores weekday behaviour, sedentary time, calorie expenditure, exercise intensity and sleep patterns before translating the findings into actionable recommendations for Bellabeat.
Wearable technology, wellness analytics and user engagement
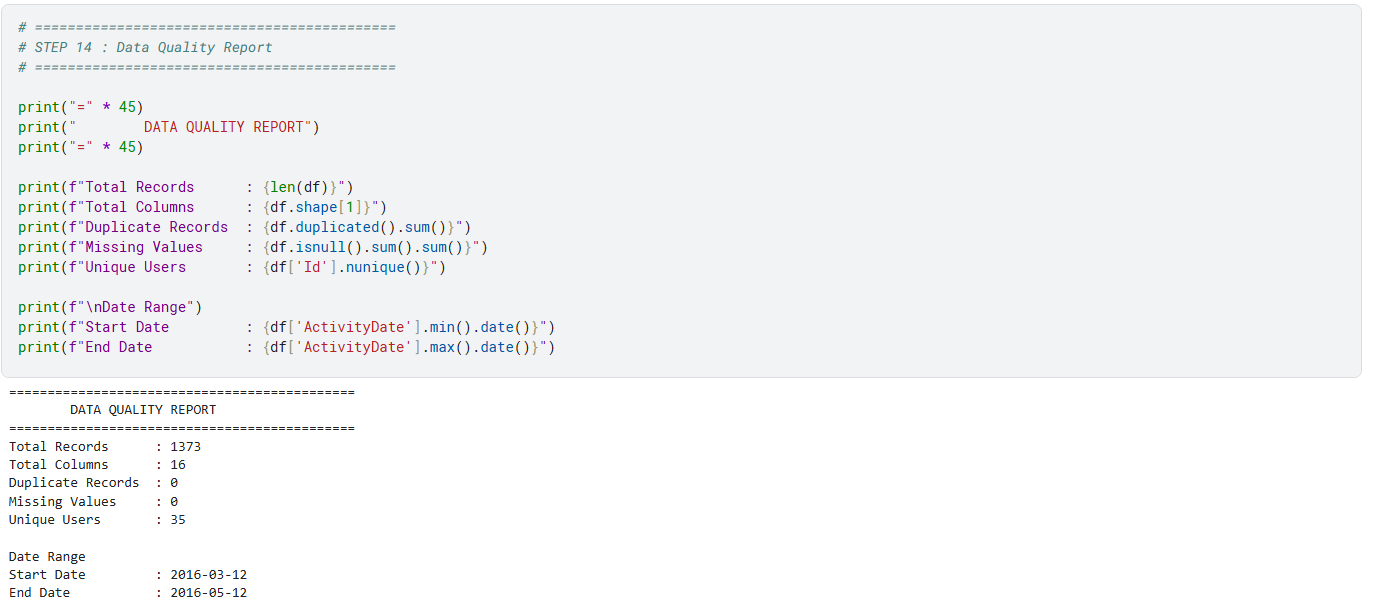
1,373 unique daily activity records from 35 Fitbit users
410 matched user-day activity and sleep records
Python, Pandas, NumPy, Matplotlib and Tableau
Bellabeat develops wellness products designed to help women monitor and improve their health. To strengthen its marketing strategy, the company needs a clearer understanding of how consumers use wearable fitness devices and which behavioural patterns may support more personalised engagement.
This project examines daily steps, calories burned, activity intensity, sedentary time and sleep behaviour to identify patterns that Bellabeat can use when designing reminders, activity goals, wellness campaigns and sleep-coaching features.
What activity and sleep patterns can be identified from Fitbit data, and how can Bellabeat use those insights to improve customer engagement and support healthier lifestyles?
The project uses Fitbit Fitness Tracker data collected during two reporting periods: March 12–April 11, 2016 and April 12–May 12, 2016. The activity datasets were combined, inspected and cleaned before being joined with daily sleep records.
Total steps, distance, calories, active minutes and sedentary minutes
Total minutes asleep, total time in bed and sleep records
Activity date, reporting date and derived day-of-week feature
Descriptive, exploratory, behavioural and correlation analysis
The project follows the six phases of the Google Data Analytics process.
Defined the business task and analytical questions.
Loaded activity and sleep datasets.
Resolved overlaps, duplicates, dates and quality issues.
Examined activity, calorie and sleep relationships.
Created Python charts and a Tableau dashboard.
Developed recommendations for engagement and wellness.
Open each step to explore the Python workflow and analytical reasoning.
import pandas as pd
import numpy as np
import matplotlib.pyplot as plt

import warnings
warnings.filterwarnings("ignore")

df.shape
df.head()
df.info()
df.columns
df.isnull().sum()

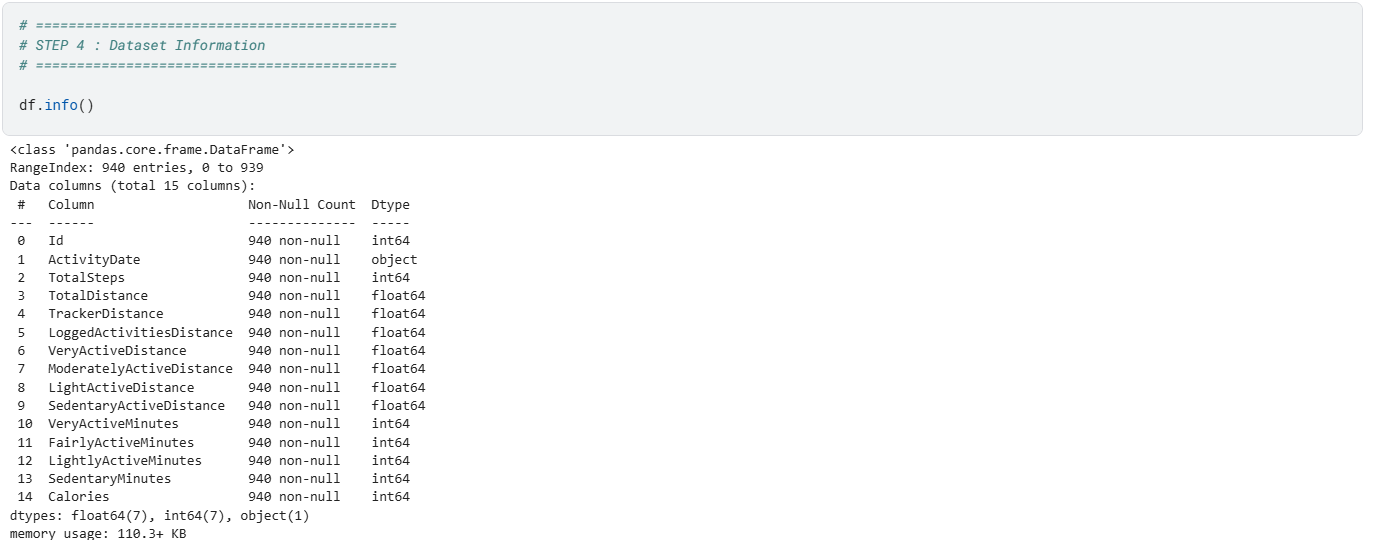

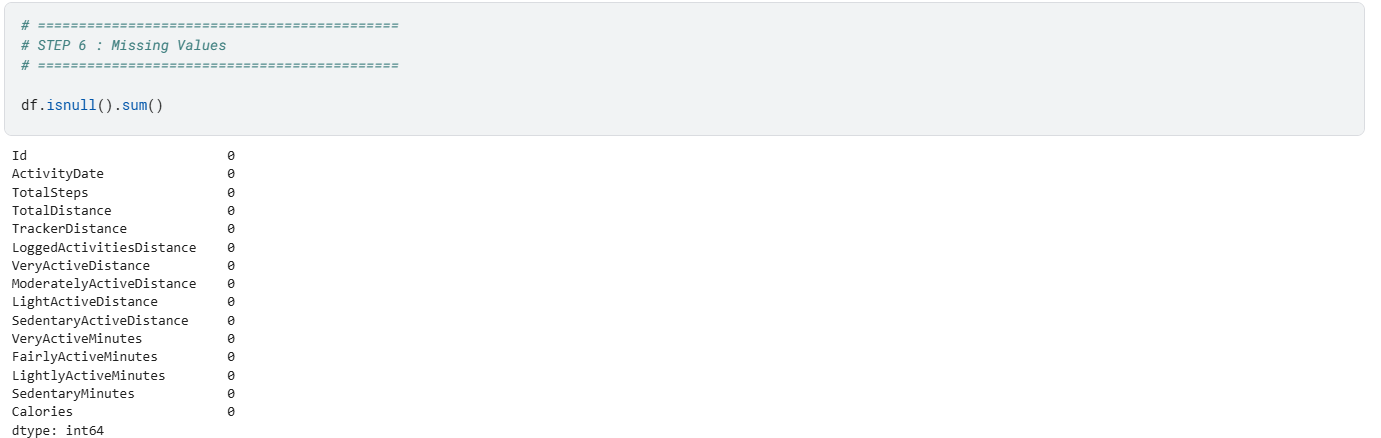
Daily activity records from both collection periods were loaded separately.
Matching structures allowed the two files to be combined.
Overlapping April 12 records were investigated and cleaned.
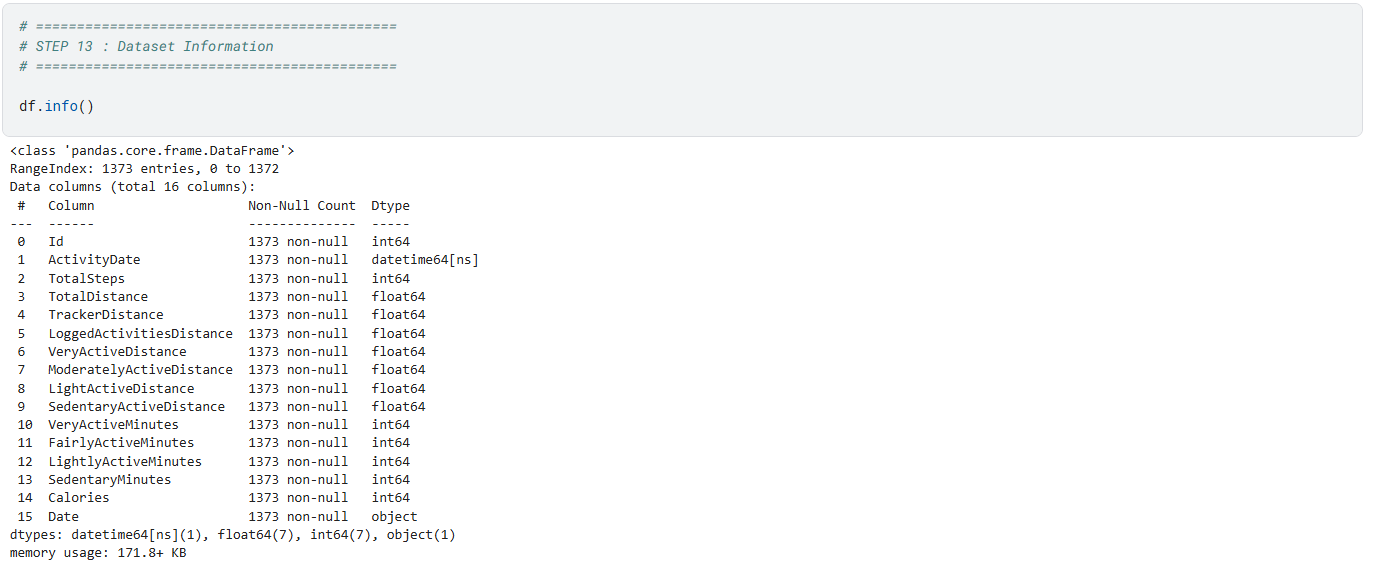
The final activity dataset contained 1,373 records with no missing values or exact duplicates.






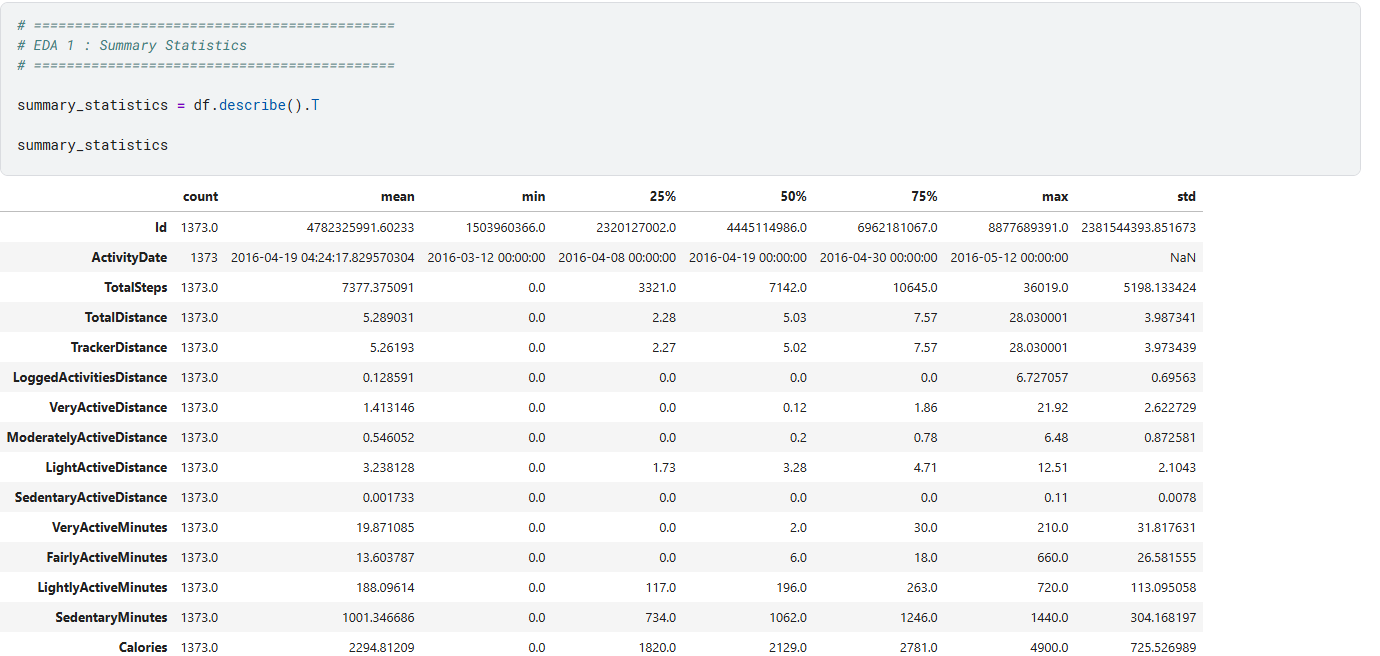
Users averaged 7,377 daily steps and approximately 1,001 sedentary minutes.
Bellabeat can focus on reducing sedentary time and increasing daily movement.
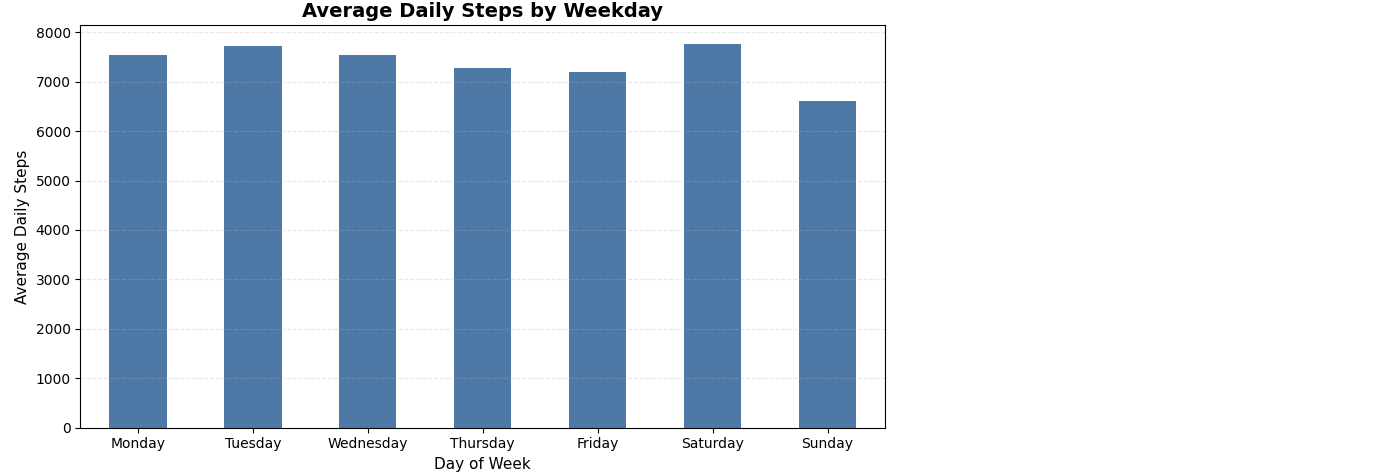
Saturday recorded the highest activity, while Sunday recorded the lowest.
Sunday reminders and targeted challenges may help maintain weekend activity.
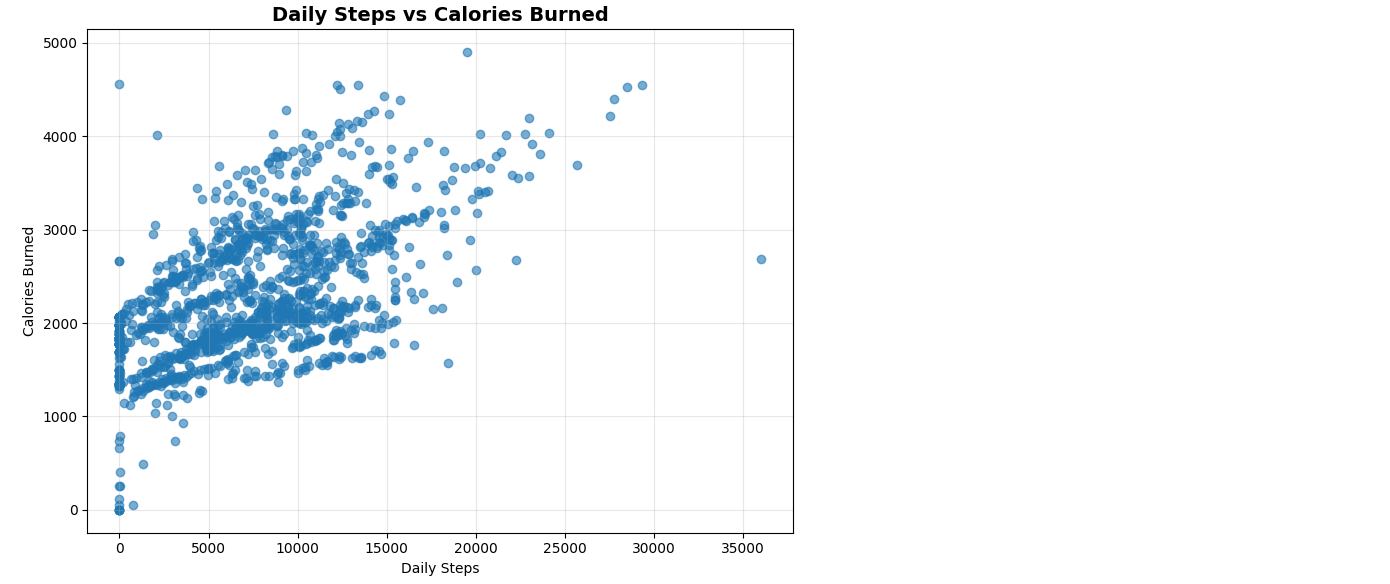
Daily steps and calories showed a moderate positive correlation of 0.58.
Step goals are useful, but activity intensity should also be promoted.
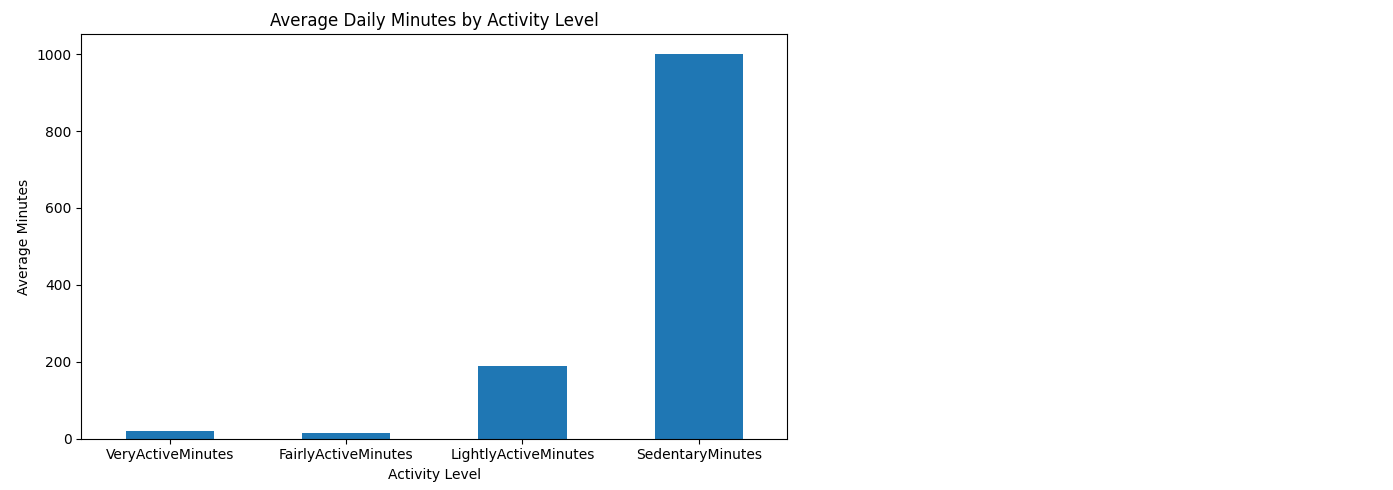
Sedentary time dominated the daily activity profile.
Movement reminders and gradual activity targets can support healthier routines.
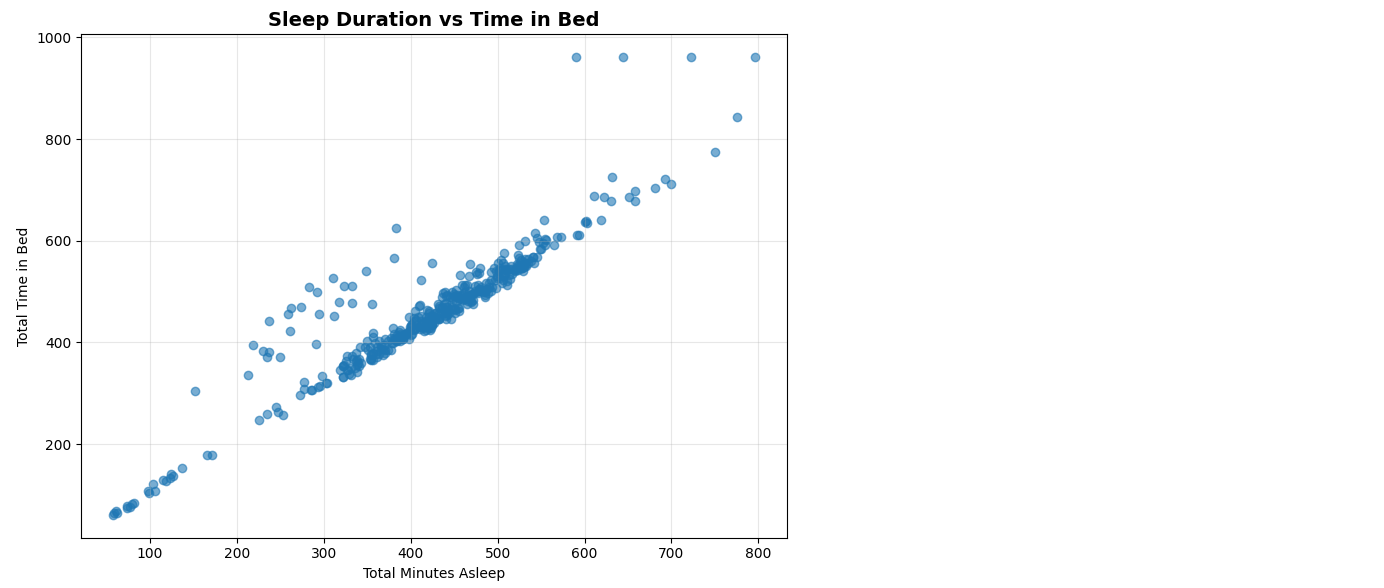
Sleep duration and time in bed had a very strong positive correlation of 0.93.
Bellabeat can provide sleep-efficiency insights and personalised sleep goals.
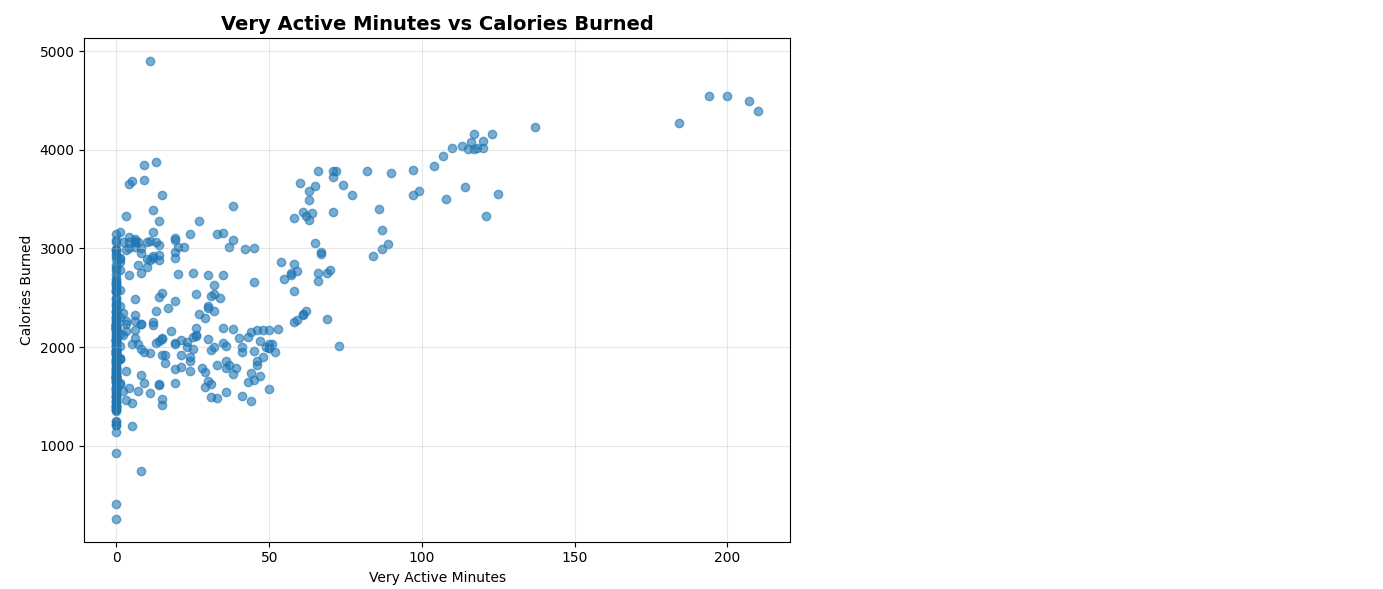
Very active minutes and calories burned showed a strong positive relationship.
Personalised vigorous-activity goals may improve fitness and engagement.
The final dashboard combines weekday activity, calorie relationships, activity intensity and sleep behaviour.
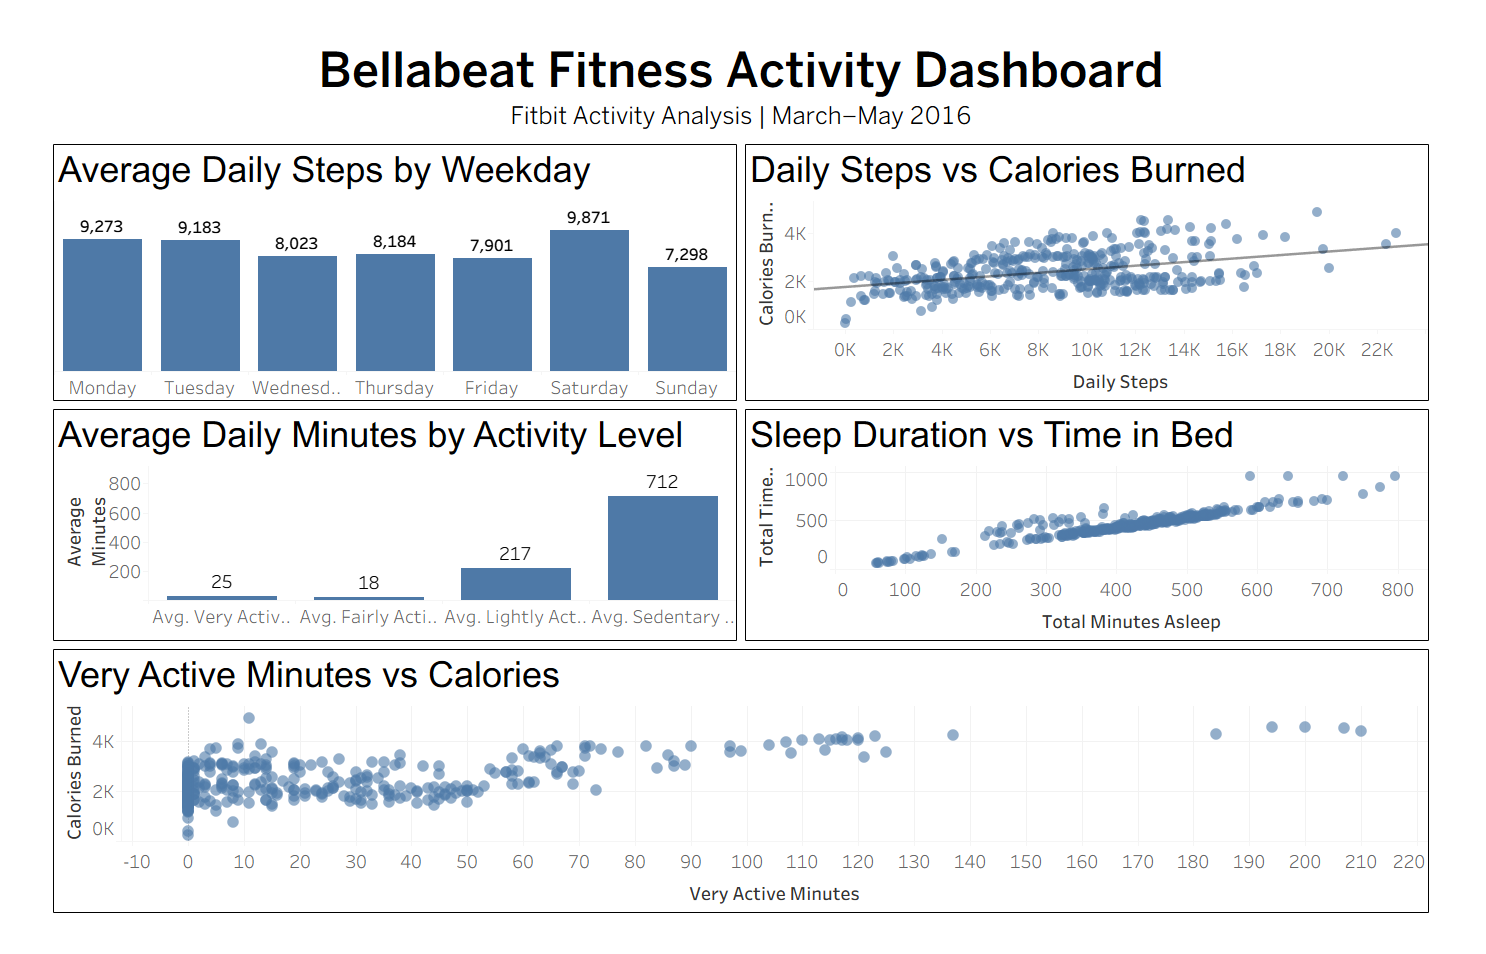
Six focused analyses explain activity, intensity, calories and sleep behaviour.
Establishes baseline activity, calorie and sedentary-time benchmarks.
Compares average daily steps from Monday through Sunday.
Measures the relationship between movement and calorie expenditure.
Compares active and sedentary minutes.
Examines sleep duration in relation to total time spent in bed.
Evaluates how very active minutes relate to calories burned.
The dashboard communicates the major findings in a concise format suitable for decision-makers.
The analysis revealed clear patterns in weekday activity, sedentary time, exercise intensity, calories and sleep.
Sunday recorded the lowest average step count.
The average indicates moderate activity with room for greater consistency.
Users averaged approximately 1,001 sedentary minutes per recorded day.
The Pearson correlation coefficient was 0.58.
A correlation of 0.93 indicated a very strong positive relationship.
Very active minutes showed a strong positive relationship with calories burned.
The findings support personalised strategies focused on consistency, movement, exercise intensity and sleep quality.
Use Sunday reminders, weekend challenges and personalised step goals.
Introduce standing alerts, movement reminders and walking challenges.
Recommend short vigorous workouts and weekly exercise goals.
Provide bedtime reminders, sleep-efficiency feedback and personalised sleep goals.
Combine activity and sleep data to generate relevant coaching and progress tracking.
This project analysed Fitbit activity and sleep data from 35 users between March and May 2016. Two activity datasets were combined and cleaned, resulting in 1,373 unique daily activity records. A separate sleep dataset was prepared and matched to activity data, producing 410 unique user-day records.
The analysis found that Saturday was the most active day and Sunday the least active. Users averaged approximately 7,377 steps per day but spent a substantial proportion of their recorded time being sedentary. Daily steps showed a moderate positive relationship with calories burned, while very active minutes showed a stronger relationship. Sleep duration and time in bed were very strongly related.
The findings support targeted activity reminders, sedentary-time reduction, personalised exercise goals and sleep-coaching features.
Replace the placeholder links below with your published Kaggle and Tableau URLs.